Performance evaluation of data-limited, length-based stock assessment methods
Authors: Lisa Chong (ZMT), Tobias Mildenberger (DTU), Merrill Rudd (UW), Marc Taylor (Thünen), Jason Cope (NWFSC), Trevor Branch (UW), Matthias Wolff (ZMT), Moritz Stäbler (ZMT)
One of the hardest problems in fisheries is to assess the status of fisheries that are data poor or limited. Numerous data-limited length-based methodologies have been developed and applied to report on the regional status of fisheries across many stocks, including Thompson and Bell (TB), length-based spawning potential ratio (LBSPR), length-based integrated mixed effects (LIME), and length-based risk analysis (LBRA). While all four methods use length-data as a primary input, estimates of stock status might vary due to differing model assumptions. The performance of these methods needs to be tested to determine which are the most accurate in different circumstances.
We tested these models by simulating large populations of individual fish, running the models, and then comparing the model estimates against the actual status in the simulations. This individual-based modelling approach allowed the authors to track individuals in populations rather than using an approximation of lengths distributed by age, thus adding a unique level of independence in the operating model.

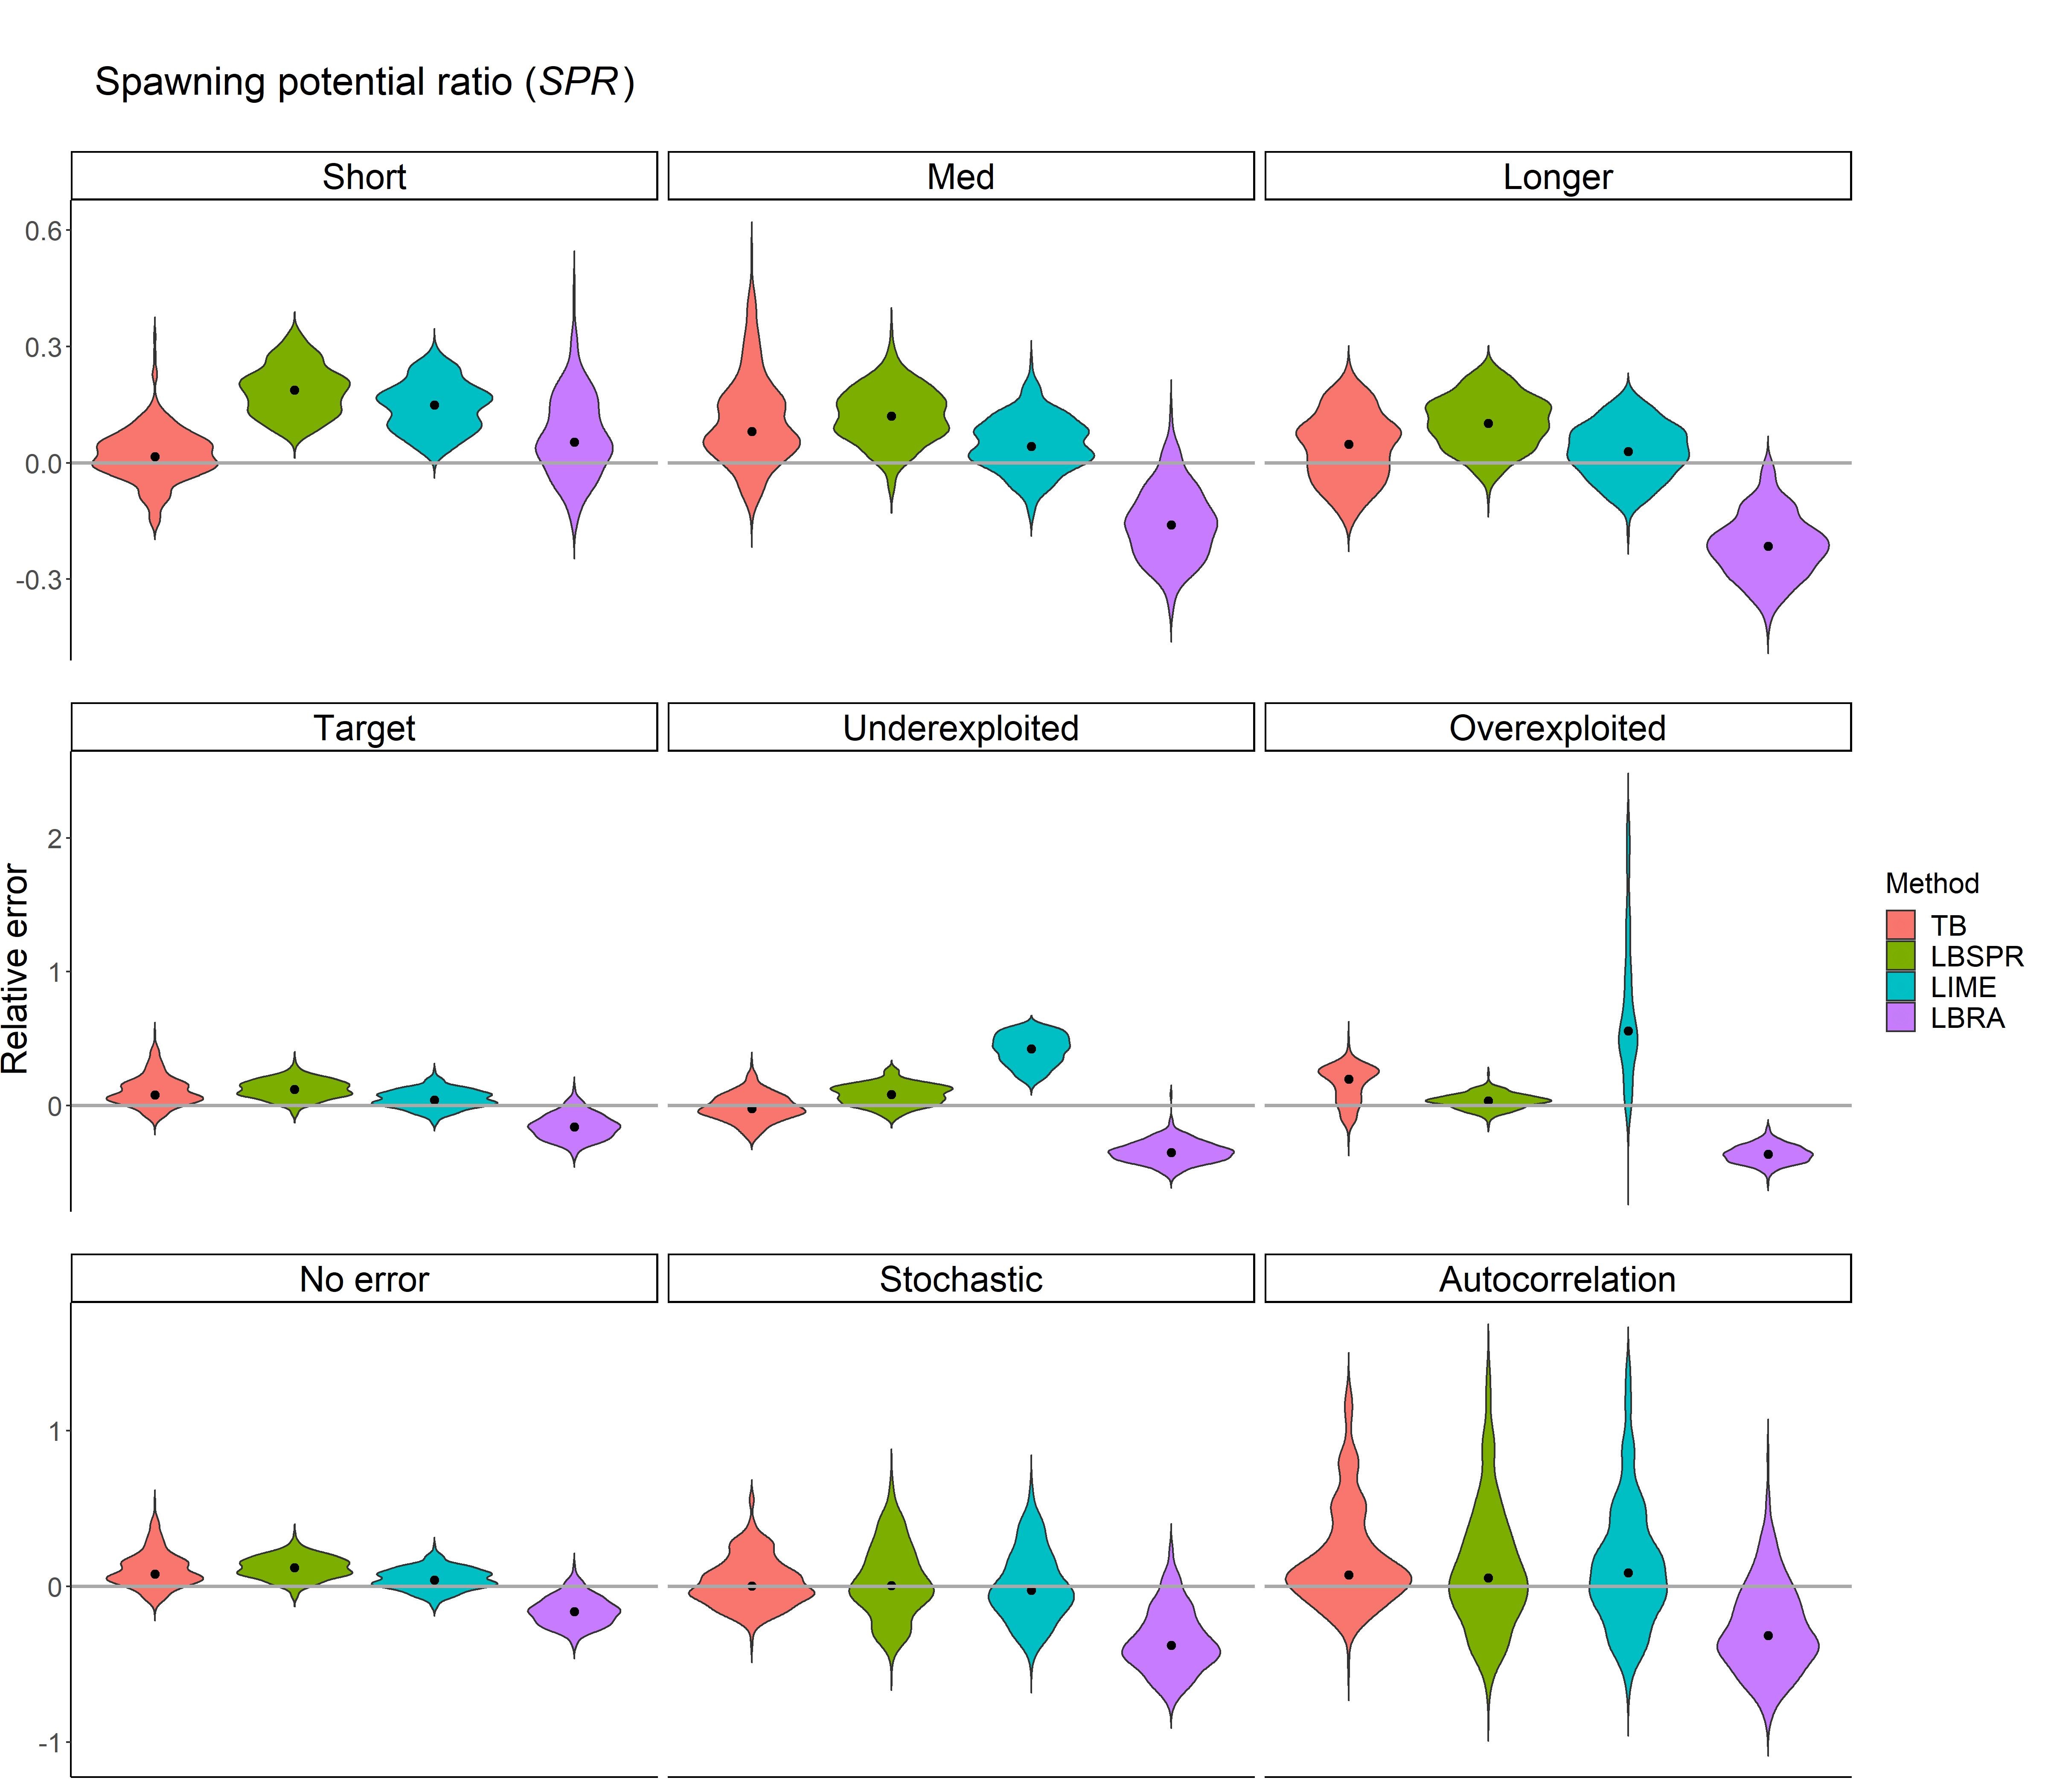
The results revealed the biases and imprecision of each method under various life history, exploitation, and recruitment scenarios. All methods have difficulties assessing short-lived species and are less accurate when analyzing severely overexploited and underexploited stocks. Increased recruitment error does increase imprecision but can decrease bias. If trends in population status and the stock recruitment relationship are unknown, the authors recommend using TB and LBSPR since both methods performed best across all scenarios.
This study highlights the importance of testing stock assessment methods against alternative model assumptions in order to better quantify their performance and to identify their strengths and weaknesses under various situations.
Now published: https://doi.org/10.1093/icesjms/fsz212
